
Combined Cohorts
Analyze your customer segment behavior across a group of cohorts
With combined cohorts in Peel, you can look at a bunch of months together and analyze cohort metrics across multiple segments in a faster more efficient view.
⚡️What is the repurchase rate by top products of my Q3 new customers?
⚡️What products had the best repurchase rate looking at the past 6 months?
⚡️What discount codes lead to the best LTV?
⚡️What is the LTV subscribers & non subscribers in the past two quarters?
etc!
With this feature you can look at a group of months (e.g. an entire summer or quarter) to analyze customer purchasing behavior instead of going month by month (Single Cohort) or all the cohorts (past 12 months, past 24 months or all data)
With the selected cohorts you set to be combined, Peel averages out the values to give you a single cohort analysis for a more top-down view.
Features, Functionalities, and Benefits
Here are just some of the features, functionalities, and benefits of using combined cohorts in Peel:
- Compare cohort metrics by segments for several months at once.
- Answer the question of what to expect from any cohort using an average of multiple cohorts.
- Use pre-built combined months based on the current month - last three months, last six months, last twelve months, and the last twenty-four months.
- Compare periods of data to each other (for example, Q1 2022 to Q4 2021).
- The flexibility to analyze your segment behavior and the analysis across various groups.
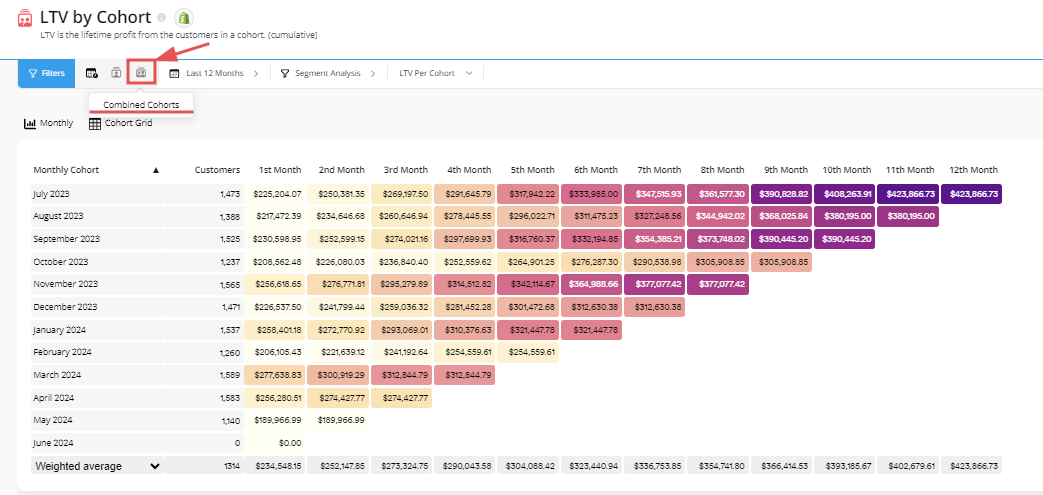
To create a combined cohort in Peel
- Visit the cohort metric.
- On the cohort type dropdown select Combined Cohorts.
- On the time button select the months that you want to combine.
- Select apply filter.
Segmentation of Combined Cohort
Like all cohort reports, you can also segment your combined cohorts from our various segmentation options offered in Peel.
To segment your combined cohort:
- Create a combined cohort using instructions from above.
- On the Segmented button click Overall to open up the segmentation options.
- Choose a segmentation option from the list of categories and parameters.
- Select apply filter.
Notes on CalculationOur goal is to show the value of any average cohort month (or week/quarter/year), so all values will be the average for any of the cohorts selected. We run a true average on the original data that we often call weighted average on the result data: we use the size of each cohort
To get the values for the combined cohorts, we use the following formula:
value = sum([values * cohort_size]) / sum([cohort_size])
Using ONLY the cohorts which had a value at the nth month
Scenarios
-
Want an overall Repurchase Rate % or LTV $ for all your cohorts combined by vendors, product, discount code, location? --> Combined Cohorts
-
What is the repurchase rate for customers who had a specific product in their order in Q3 vs. Q4. --> Combined Cohorts
Updated about 1 year ago