
Peel Slices
This visualization displays multiple metrics at once in a large table, for one specific segment. This new user interface adds an exciting new dimension to the current visualizations in Peel’s platforms.
To create a Slice in Peel
- Select the date range you want to look at - 30 days, 3 months, 6 months, 1 year, etc.
- Choose the segment you want to explore - Revenue, Cost, Customers, marketing, Orders, Profit, Products, Subscriptions, Transactions
- Click on the
+to add Slice to the dashboard.
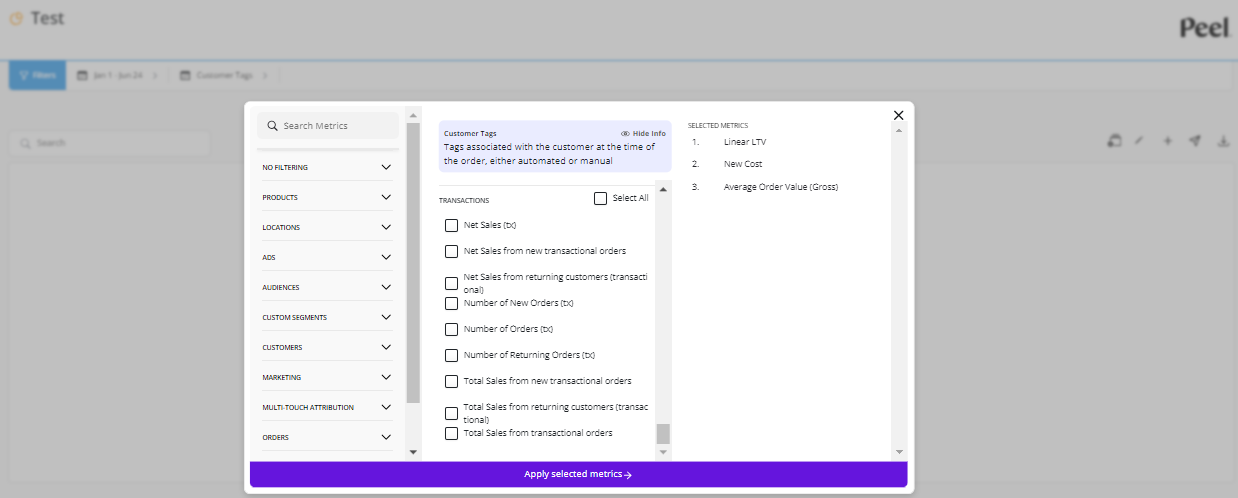
TipThe Metrics - You can choose as many metrics as you like and can compare Gross Sales, AOV, churn rate, CAC.
Metrics availability depends on the segment.
You are able able to:
- Compare segments across multiple metrics picked individually in a table view.
- Share, download, revisit over and over again.
Updated about 1 year ago