
Market Basket Analysis
Market Basket Analysis tells the story of what products people buy together.
Market Basket Analysis - tells you what your customers are buying together. What are all the combinations of products that make up the orders. 💡
This is the way to find out the combinations of orders that make up your highest volume or orders & revenue.
Are people buying more of product A + product B or product B + product C, etc.
This analysis will uncover associations between items!
You can use it to answer questions such as:
- What are customers buying in their orders?
- Are the upsells you are testing working?
- Should you be making product bundles?
- What packaging should you optimize for?
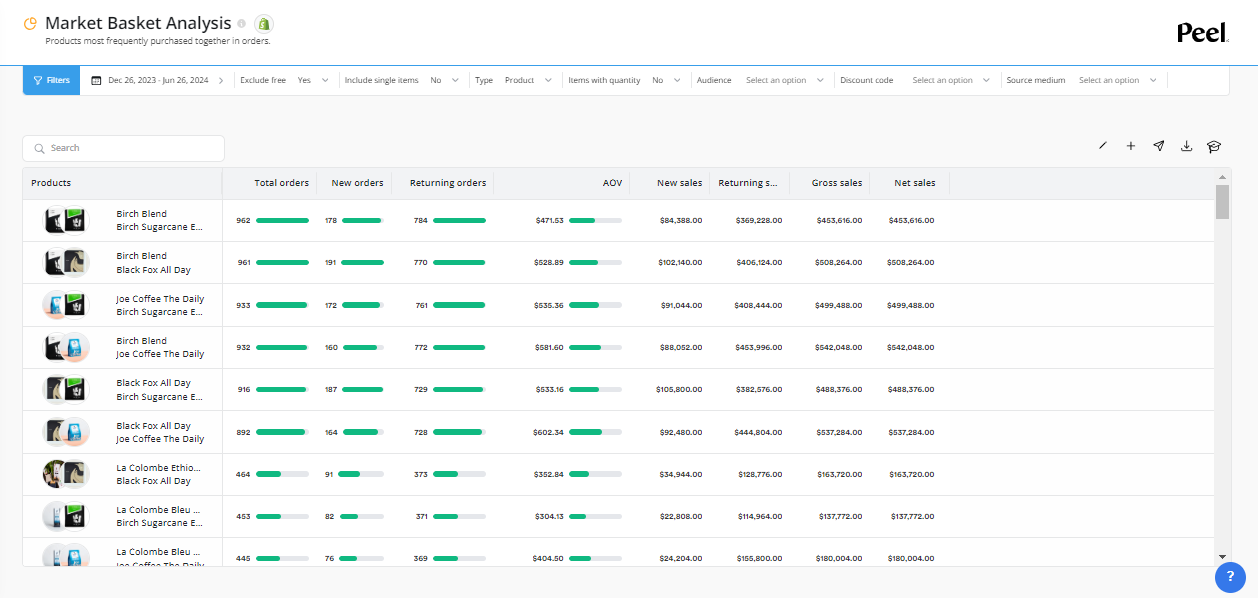
Market Basket Table
for example
Accessing the Market Basket Analysis
To access the Market Basket Analysis slice:
- Navigate to the left side menu to the Essentials
- Click on Market Basket Analysis.
Functionalities and Options
- Pick a date range for the table
- Exclude Free
- Include single item
- Type. For example: variant, product type, etc.
- Audience
- Discount
- Source medium
- Add to the dashboard, share and export
Table Definitions
| Metric | Description |
|---|---|
| Total Orders | The number of orders placed each day. |
| New Orders | The number of first-time orders placed each day. |
| Returning Orders | The number of repeat orders placed each day. |
| AOV | Average amount spent by customers on each order placed |
| New Sales | Sum of revenue on first-time orders = gross sales - discounts - returns + taxes + shipping charges. |
| Returning Sales | Sum of revenue on repeat orders = gross sales - discounts - returns + taxes + shipping charges. |
| Gross Sales | Sum of gross sales = product price x quantity (before taxes, shipping, discounts, and returns). |
| Net Sales | Net sales does not include shipping charges or taxes. It will be a positive number for a sale on the date that an order was placed, and a negative number for a return on the date that an order was refunded. |
Feedback and Comments?
We'd love to hear your experience with our new product analysis feature. Let us know! [email protected].
Updated about 1 year ago