
RFM Analysis & Home Page
Focus on your retention north star metrics with your new Home Page in Peel. It highlights the number of orders per customer, the average LTV per customer, and the percentage of returning orders.
Below it, start taking action immediately by reviewing the RFM segments for all your customers. RFM analysis (Recency, Frequency, and Monetary value) lets you really dig into customer behavior so that you can focus on retention, loyalty, and building customer relationships.

More about the North Star Metrics for retention
Orders per customer - For most ecommerce businesses, your costs of the acquisition have gone higher, meaning most of the profit comes from the second, third, and later orders each customer places. The average number of orders per customer will have a minimum of 1, and we visualize your progress up to 3 orders. The metric is the total number of orders divided by the total number of customers for your account.
LTV per customer - Lifetime Value per customer is the average amount of profit earned per customer for customers who placed their first purchase in the past 24 months. Recent customers will skew this number lower, given the shorter time to place multiple orders, and stale customers will stop being counted after two years.
LTV = Net sales - Costs
(Net Sales = Gross Sales - Refunds - Discounts)
Lifetime value is an essential metric that helps you to optimize your marketing budget and set goals regarding your customer acquisition costs. It is the predicted net profit you can expect from any customer over the course of your business relationship. Learn more about it here.
Returning orders weekly (to New) - This is the percentage of orders from returning customers compared to the number of orders from new customers. The value is based on the average of the past 7 days. Each business is different, but you want a healthy mix of new and returning customers to grow and retain. Subscription-heavy shops will find that having a high percentage of returning customers is healthy. If you do not sell subscriptions, having a high percentage returning each week might indicate few sales overall. Use this metric to measure your progress over time toward a higher number of orders per customer!
RFM Segments

RFM stands for Recency, Frequency, and Monetary value, each an important indicator of customer behavior.
- Recency - How recently did the customer make a purchase? If the customer has made a purchase more recently, then they are likely to be more responsive to outreach and promotions
- Frequency - How often does the customer place an order? If a customer purchases more frequently, then they are more engaged and satisfied
- Monetary Value - How much do your customers spend per order? Every purchase is valuable, but combining this factor with how recently or frequently a customer purchases could indicate if they are a brand loyalist
RFM can help you answer these questions:
- Who can you upsell higher-value products to?
- Who can you send personalized messages to keep them from churning?
- Who is most likely to engage with your brand?
- Who can you offer limited-time offers to and try to reactivate?
RFM analysis groups all of your customers into ten groups based on their scores. You can also make an Audience for each group to take further action or dig deeper into the analysis.
All customers in your account will be given an RFM segment using their score of 1 to 5 (integer values) on three metrics:
- Recency (number of days)
- Frequency (number of orders)
- Monetary (LTR - Lifetime Revenue)
A score of 5 means a customer is in the top 20% group, and a score of 1 indicates a customer is in the bottom 20% group. The scores depend on the trends and purchasing behaviors specific to your store. We update the scores daily.
One thing to note is that the size of the squares in the RFM Analysis does not change if the number of customers in each square increases or decreases.
The size depends on the grid system of Recency on the bottom axis and Frequency+Monetary value on the Y axis. For example, customers in the Promising group have 4 Recency and 1 Frequency+Monetary.
Customers start out in the bottom right, and the goal is make to the top right.

There are 10 groups of customers, each based on the RFM scores:
| Category | Recency | (Frequency + Monetary) / 2 |
|---|---|---|
| Champions | 5 | 4-5 |
| Loyal Customer | 3-4 | 4-5 |
| Potential Loyalist | 4-5 | 2-3 |
| New Customers | 5 | 1 |
| Promising | 4 | 1 |
| Needs Attention | 3 | 1-2 |
| About to Sleep | 3 | 3 |
| Can't Loose Them | 1-2 | 5 |
| At Risk | 1-2 | 3-4 |
| Hibernating | 1-2 | 1-2 |
Build an Audience from RFM Segments

Click on any RFM group to make an Audience.
- Give the Audience a name
- Choose how many customers you want to include in the Audience
- Once the Audience is created, you can send the list of customers to a connector (ex. Klaviyo) to include in your marketing campaigns
The Audience created will be Static - meaning that it will not update with new customers that meet the criteria of the group.
You can use Peel's Audience Traits to get ideas of learn as much as you can about that Audience.
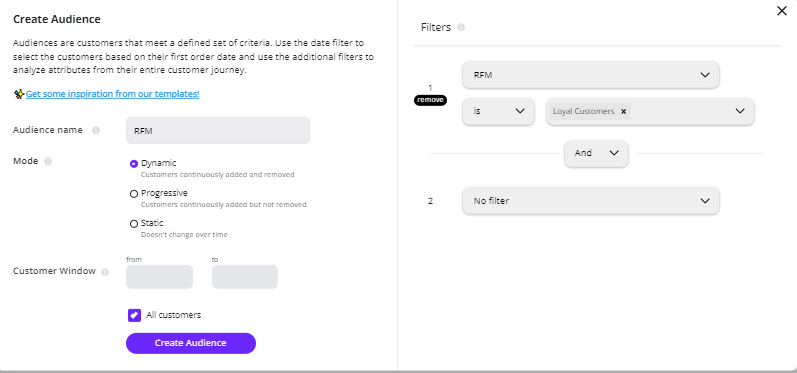
RFM Segments with the Audiences UI
Alternatively, RFM Segments can also be found within our Audiences UI for use as filter values.
Simply create a new Audience and select "RFM" as a filter. All of the various RFM Groups can be selected for use within Audiences, and additional filters can be added to your query.
Updated about 1 year ago