
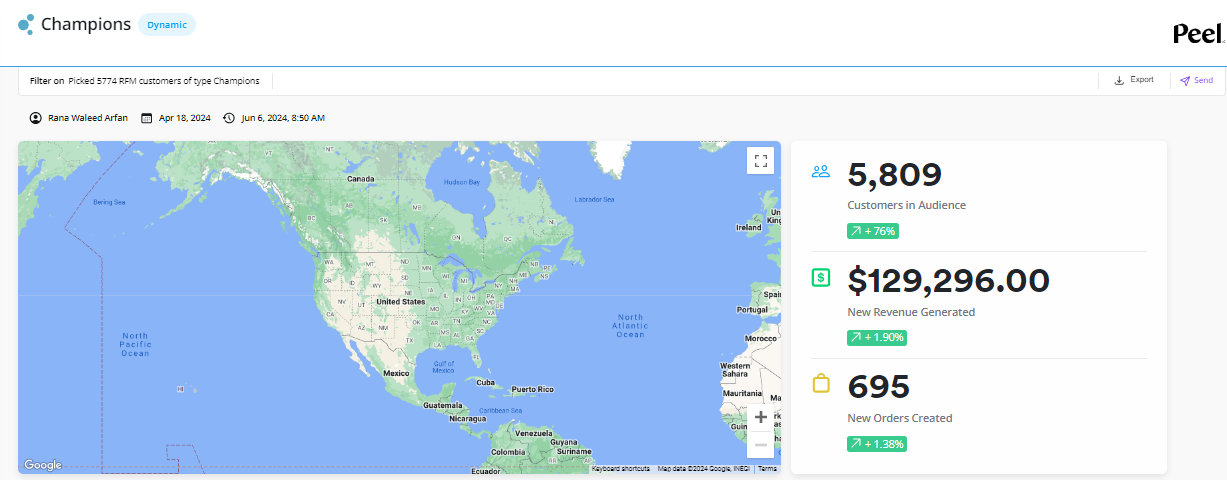
Audiences Overview & Page Breakdown
The ultimate tool to connect, communicate, measure, and retain your customers regardless of any real-world conditions. Within a few minutes, you can create hyper-targeted & personalized marketing campaigns through marketing platforms like Klaviyo (email) and Attentive (SMS). Endless targeting. Limitless growth. Increased loyalty & LTV.
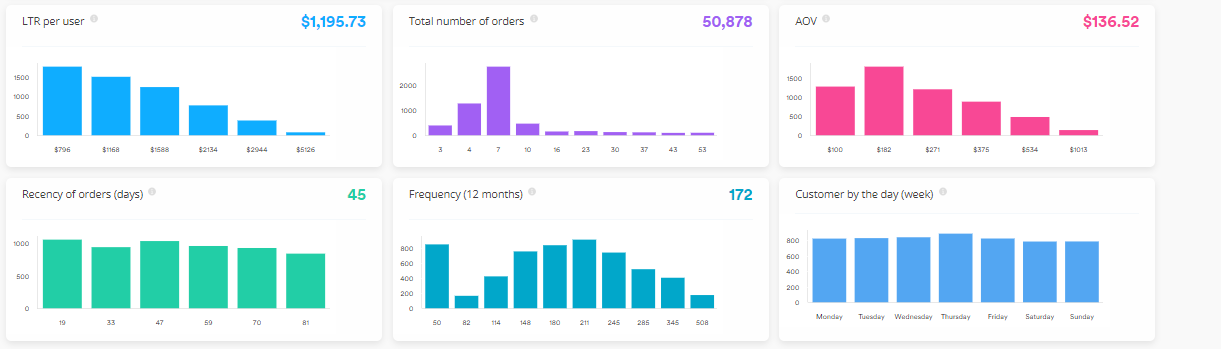
Interpreting the graphs in Peel Audiences
| Graph | Description |
|---|---|
| LTV per user | Lifetime Value (LTV) is Net Sales - Product Costs. We use this visualization to group customers by their LTV. Each bar reflects an LTV group and counts the total number of customers from this audience grouped by their LTV. |
| Total number of orders | The total number of orders for all the customers in the Audience. Each bar shows the total number of customers grouped by how many times they have ordered. |
| AOV | Average Order Value (AOV) is equal to total sales divided by the number of orders. This chart show the AOV - the average amount spent each time a customer places an order for all the customers in the Audience. We use this visualization to group customers by their AOV. Each bar shows the total number of customers grouped by AOV. |
| Recency of orders | Recency is the average number of days since a customer in the Audience placed their last order. We use this visualization to group customers by the average number of days since their last order. |
| Frequency | Frequency is the number of days between purchases during a period of at least 365 days. Customers with one order will have a frequency of 365 = once a year. The visualization groups customers by their frequency value, and each bar show the size of each group of customers from the most frequent customers to the least. |
| Customers by the day (weeks) | Customers by the day of the week groups customers by the day of the week that their order was placed, so you can see what day of the week drives the most purchases. |
Audience Account Health
Account Health is relative to your data and the purchasing patterns of your customers. It's based on the relationship between the last time a customer ordered vs. the average time between their orders. We calculate a score between 0-100 for them where 0 is very good and 100 is likely churned.
Formula:
It is the days since last order divided by twice the time it took between purchases (for customers with at least 2 orders) *100.
This gives a number between 0-100
If more than 100, the function will return 100
Ranges:
0-25 --> Great
26-50 --> On track
51-75 --> Needs attention
76-100 --> Likely churned
Examples:
- If a customer bought 2 days ago and on average buys every 10 days --> they will get a score of 10, which means the account is in very good health
- If a customer bought 2 times and their last order was 3 months ago --> they are likely churned
- If a customer hasn't bought anything in 90 days but used to buy every 30 days --> they will get a high score and are likely churned
Updated about 1 year ago