
Magic Dash
An AI-driven dashboard, unlike anything you’ve tried before.
What is Magic Dash?
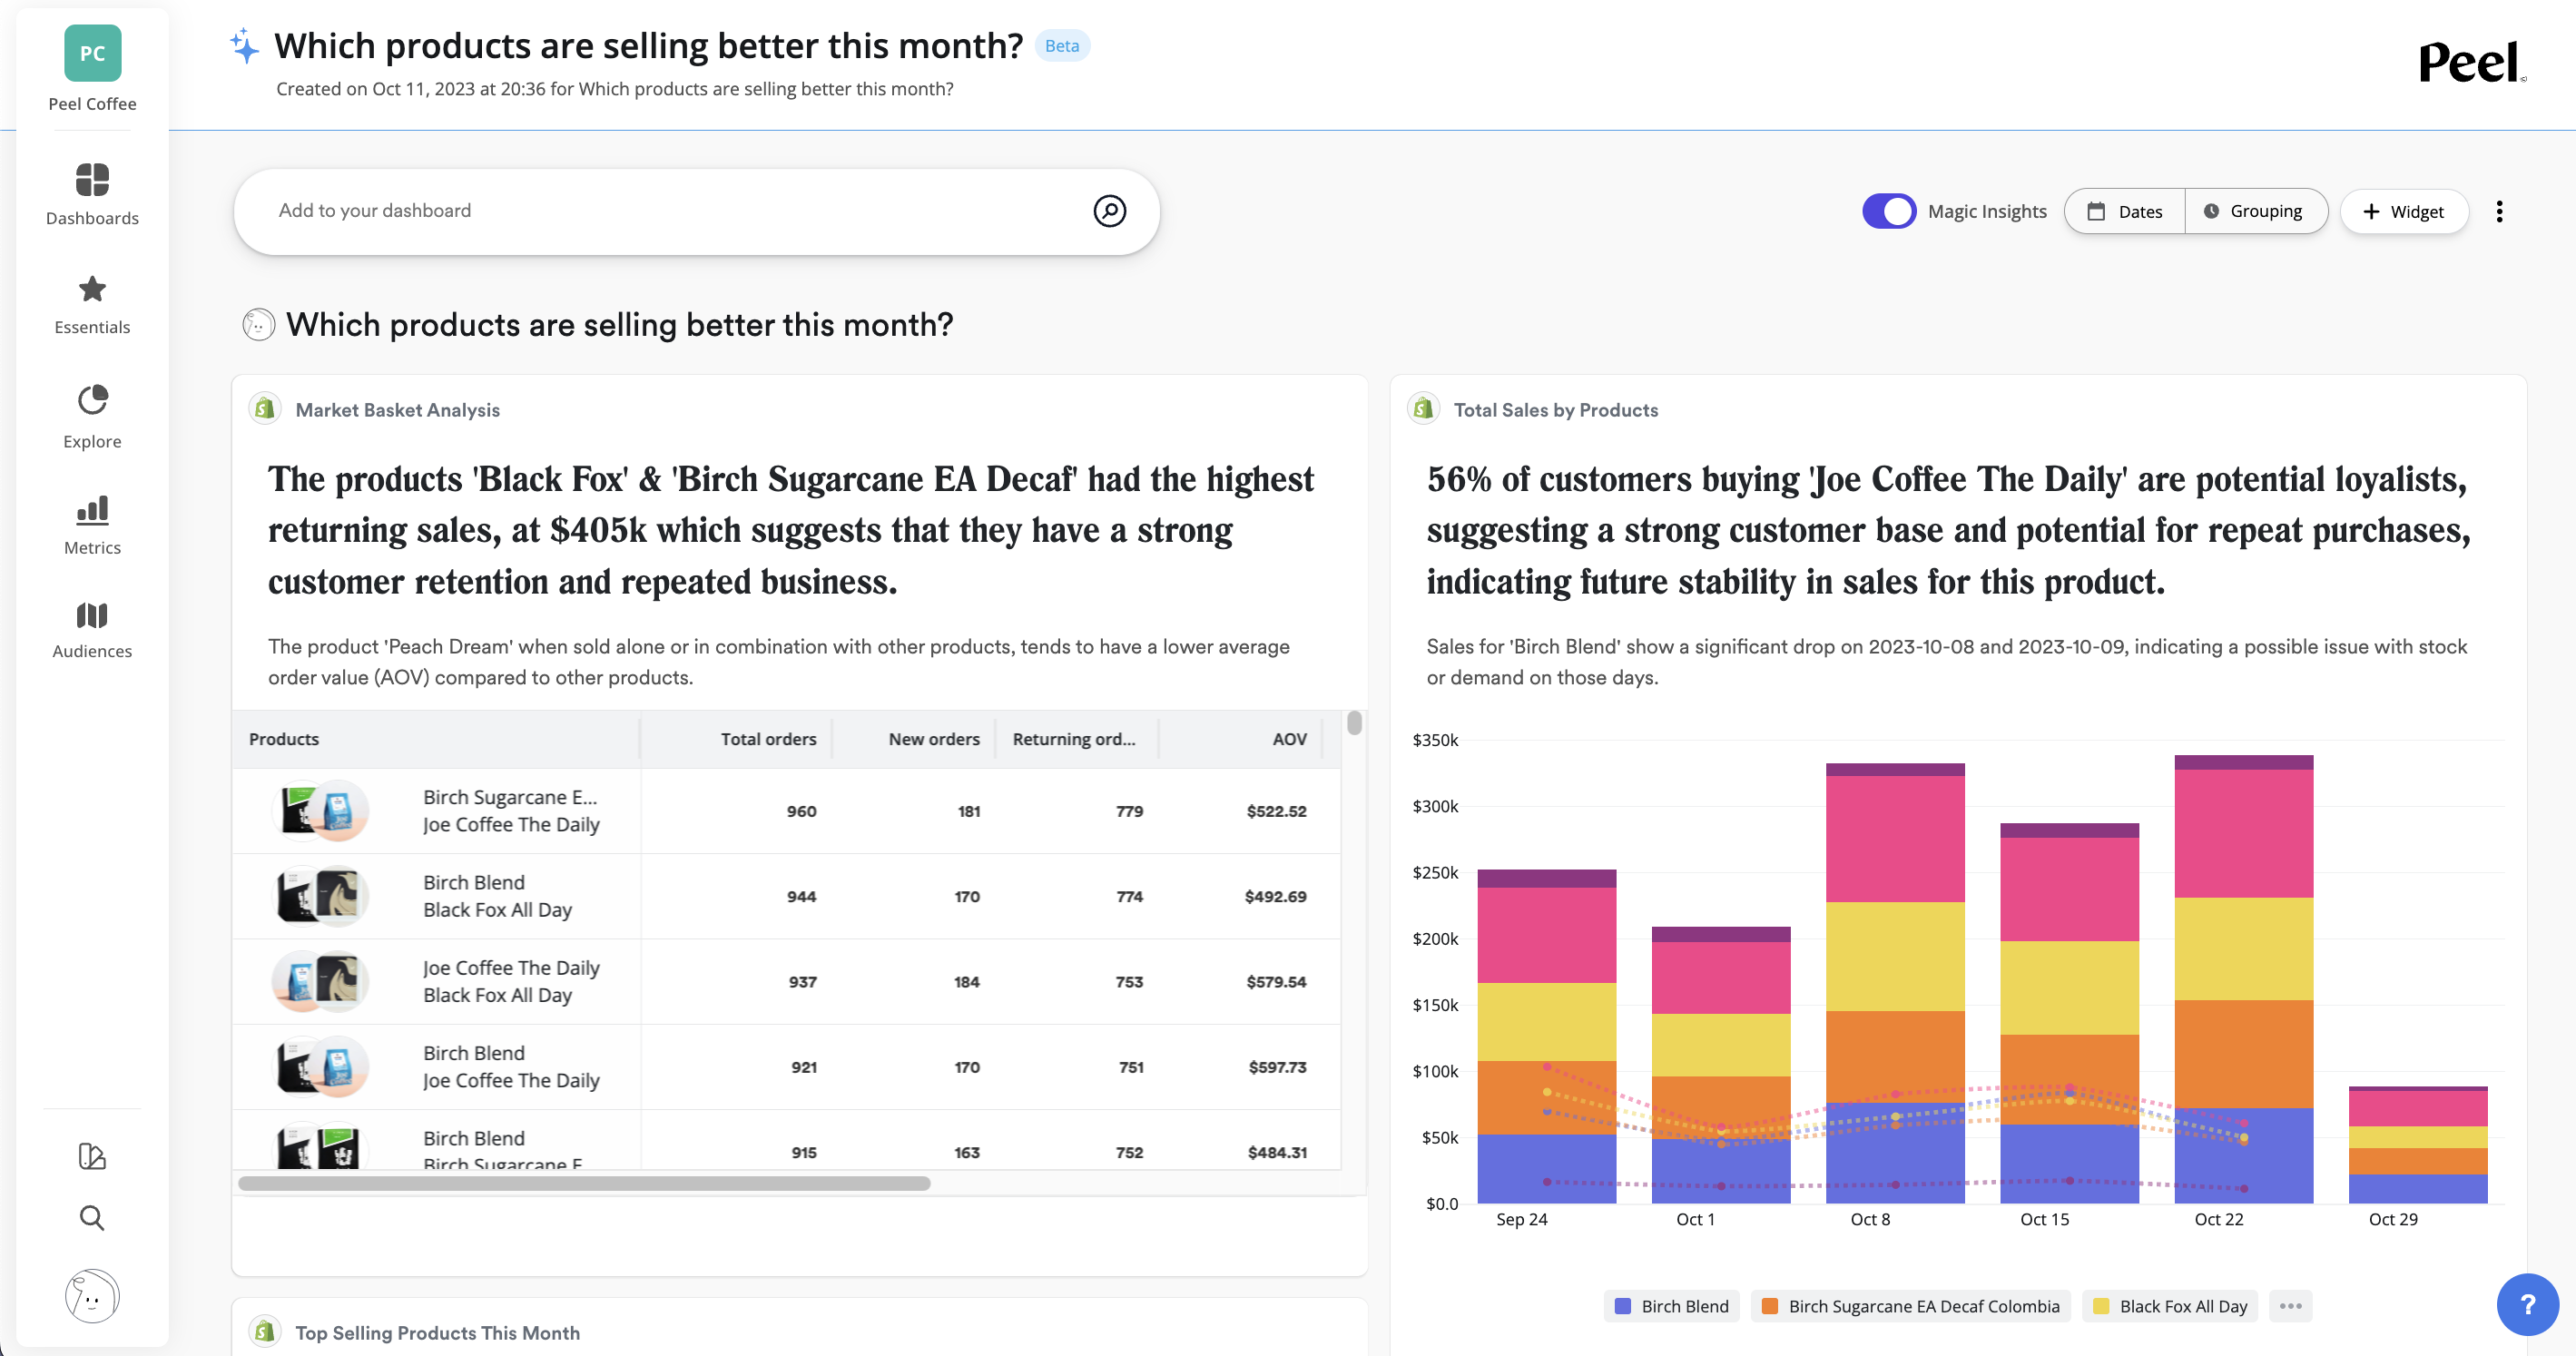
The Magic Dash is an AI-driven dashboard, unlike anything you’ve tried before. It brings all of Peel's features together and will change how you interact with data.
Check out the FAQs here
How does it work?
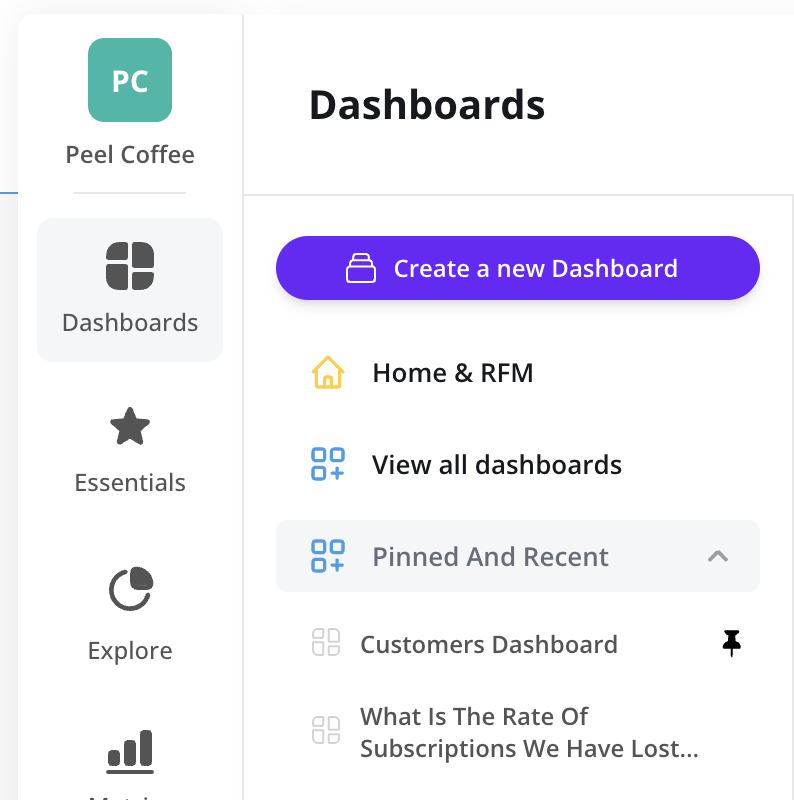
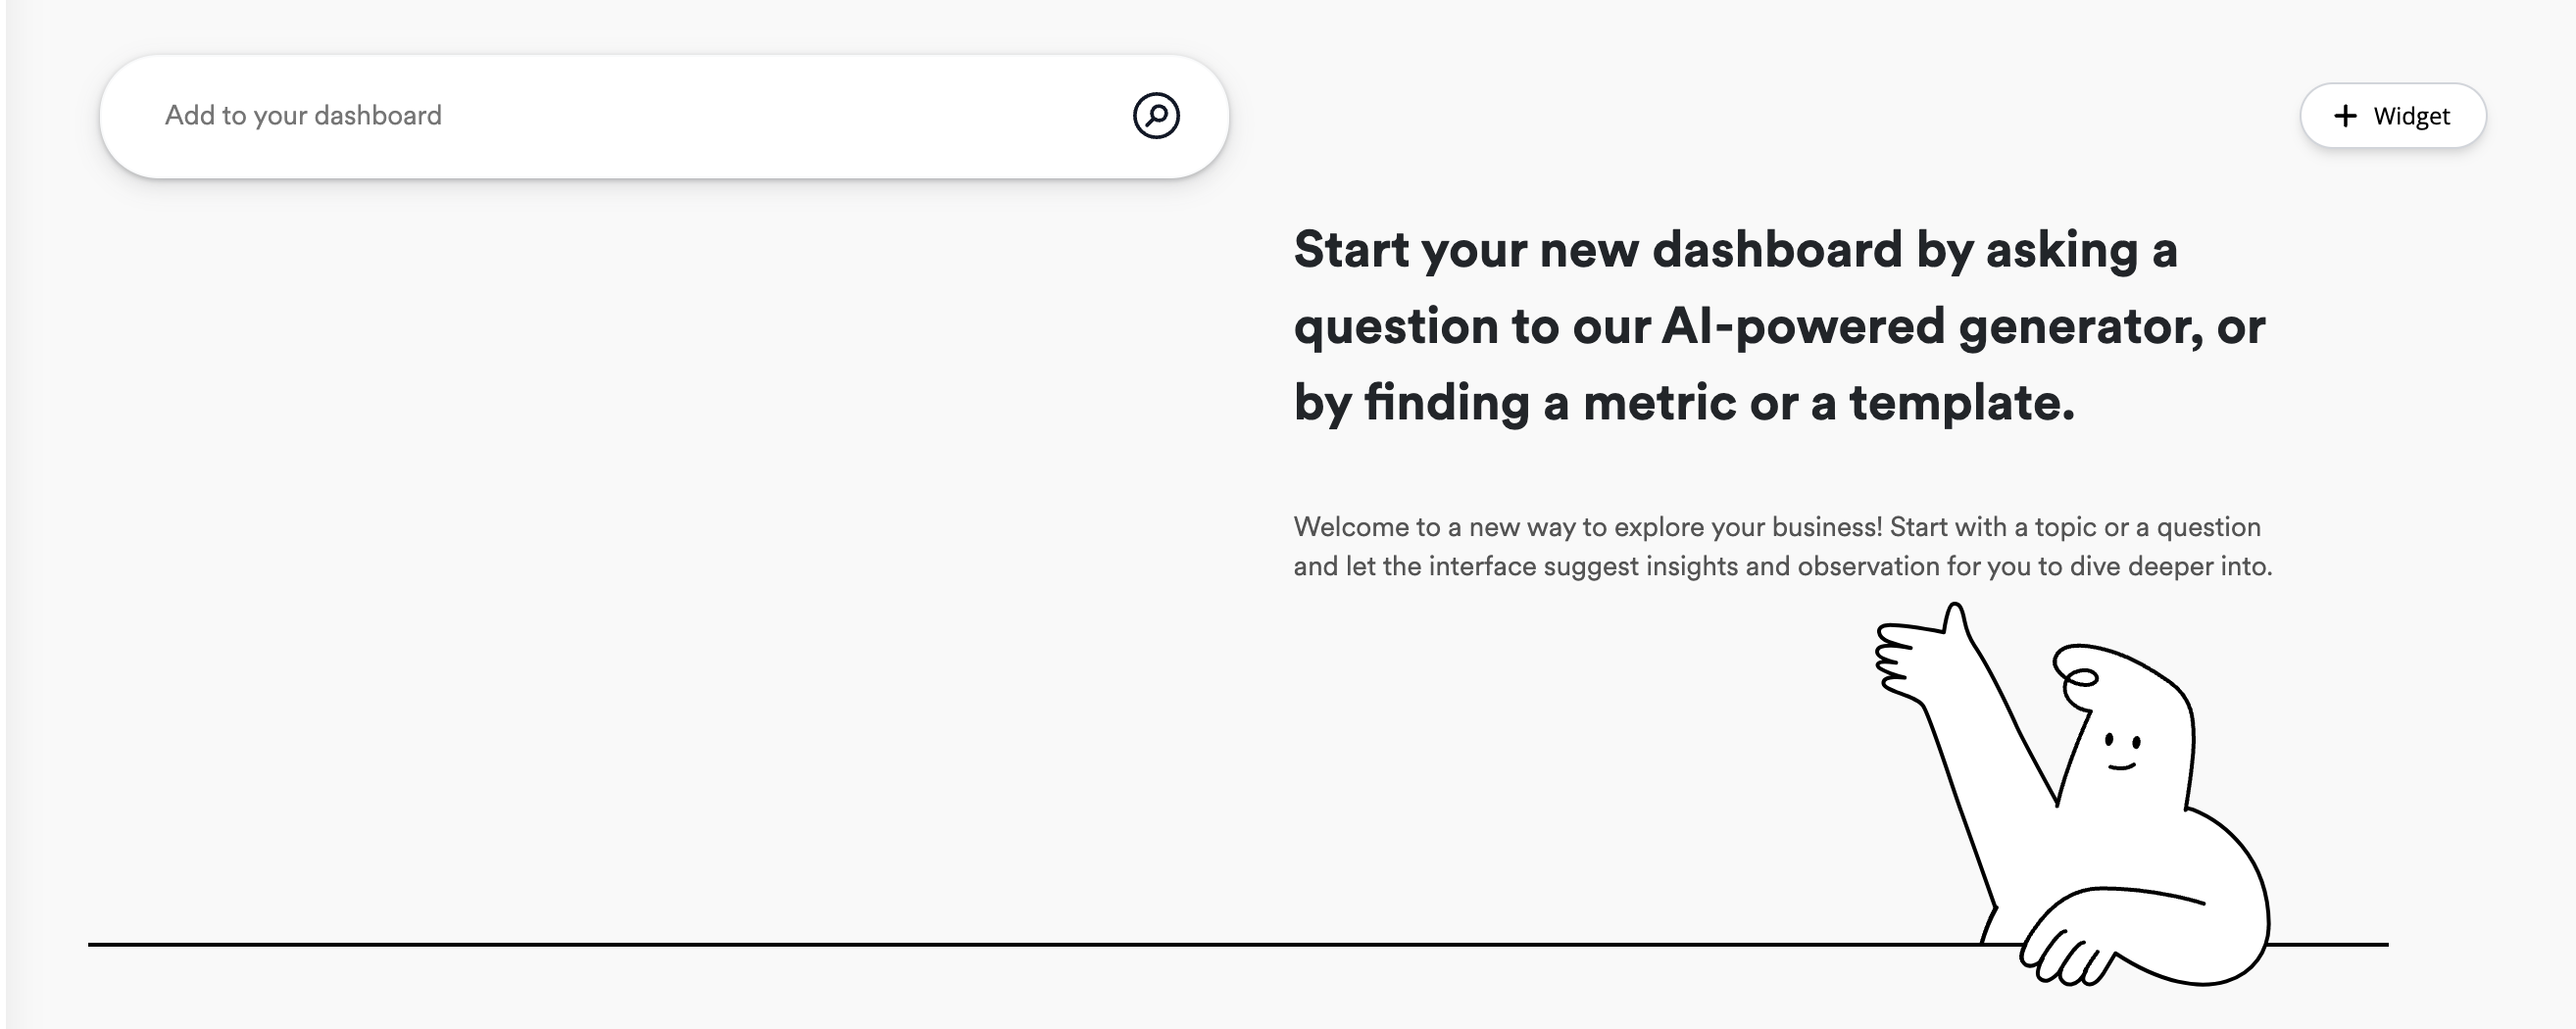
To get started, Click on Dashboards in the navigation and then select Create a new Dashboard. On the Magic Dash page, you can ask Peel's AI a question about your business and it will automatically generate a dashboard to help answer your question.
Note: your data is shared with the AI
What can I ask and what will it answer?
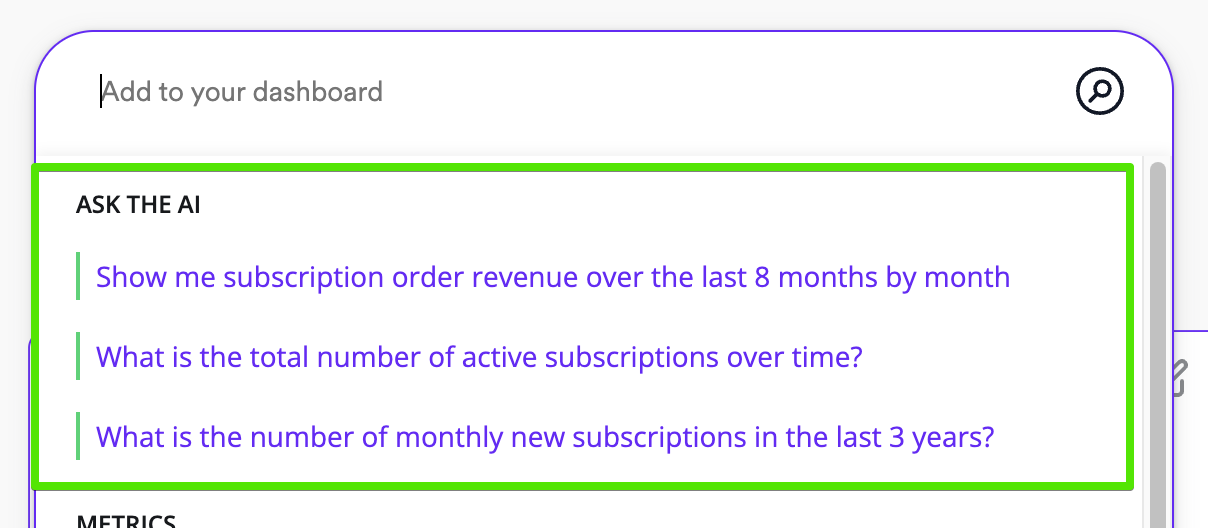
After your Dash is created, you can use the input field located at the top left corner of the page to ask additional questions to the Magic Dash. These questions can pertain to the questions you have already asked, or you can ask an entirely different question altogether. To view the most recent results, simply scroll down to the bottom of the page.
Unsure of what to ask next? Try clicking any of the "Ask the AI" questions in the dropdown
Read more about Questions to Ask the Magic Dash
Magic Dash settings
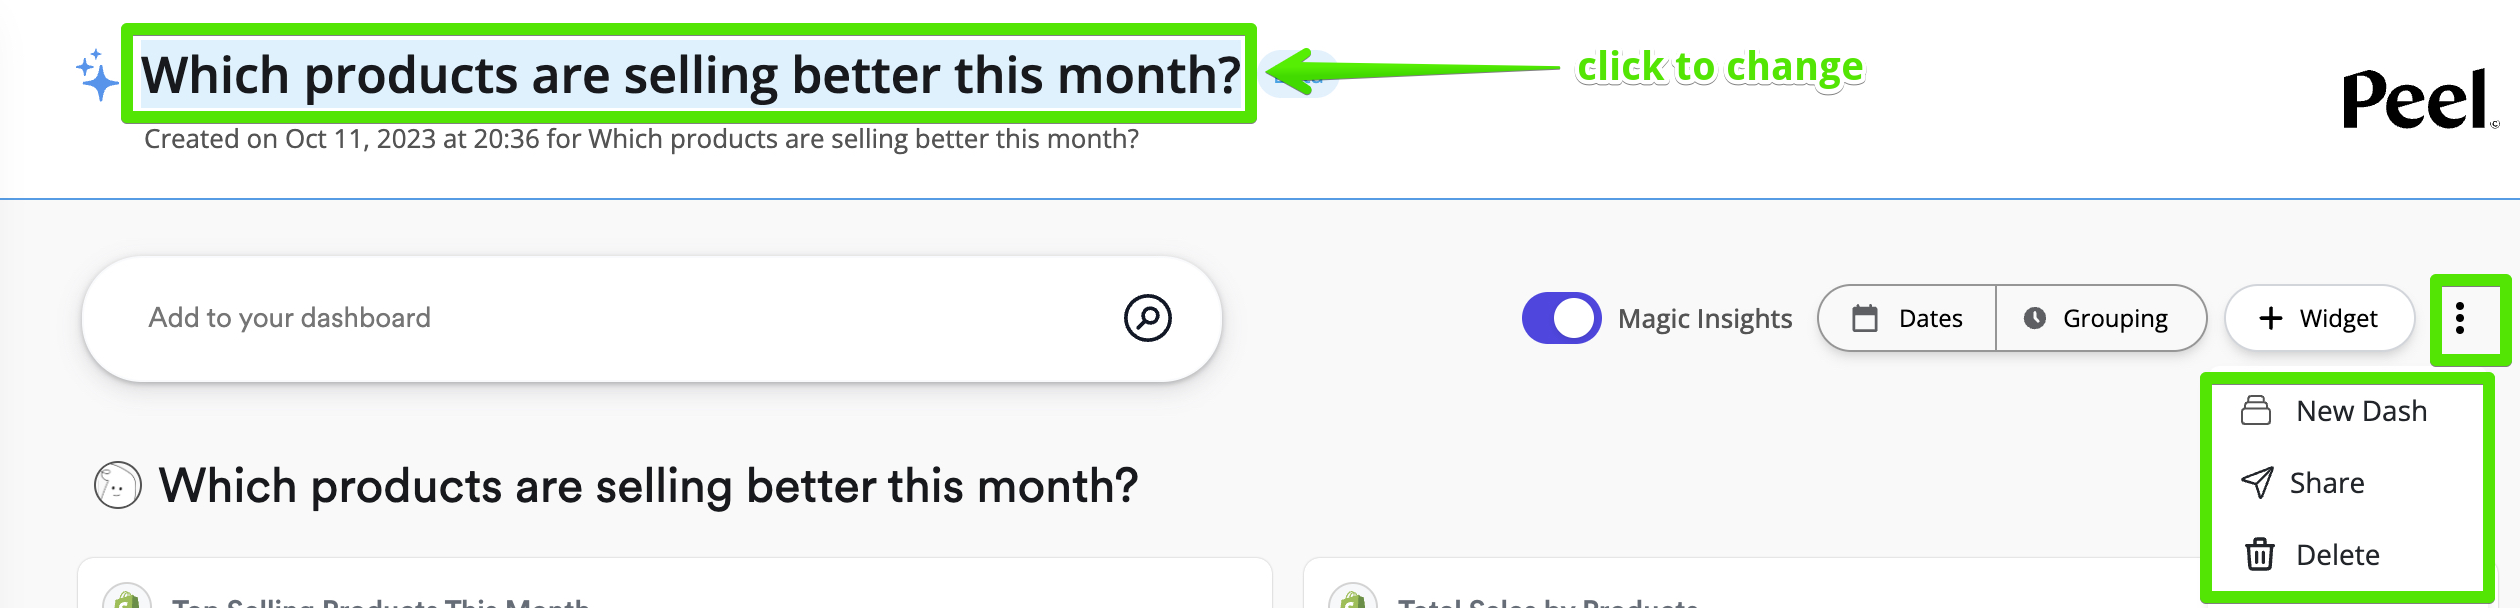
- You can change the title of the Dash by clicking on it
- Click on the 3 dots on the top right of the page to create a new Dash, share it, or delete it
What are Magic Insights?
Magic Insights are headlines about your data that are automatically created by the AI to help you gain a deeper understanding of your data. They refresh every 7 days.
How to use Magic Insights
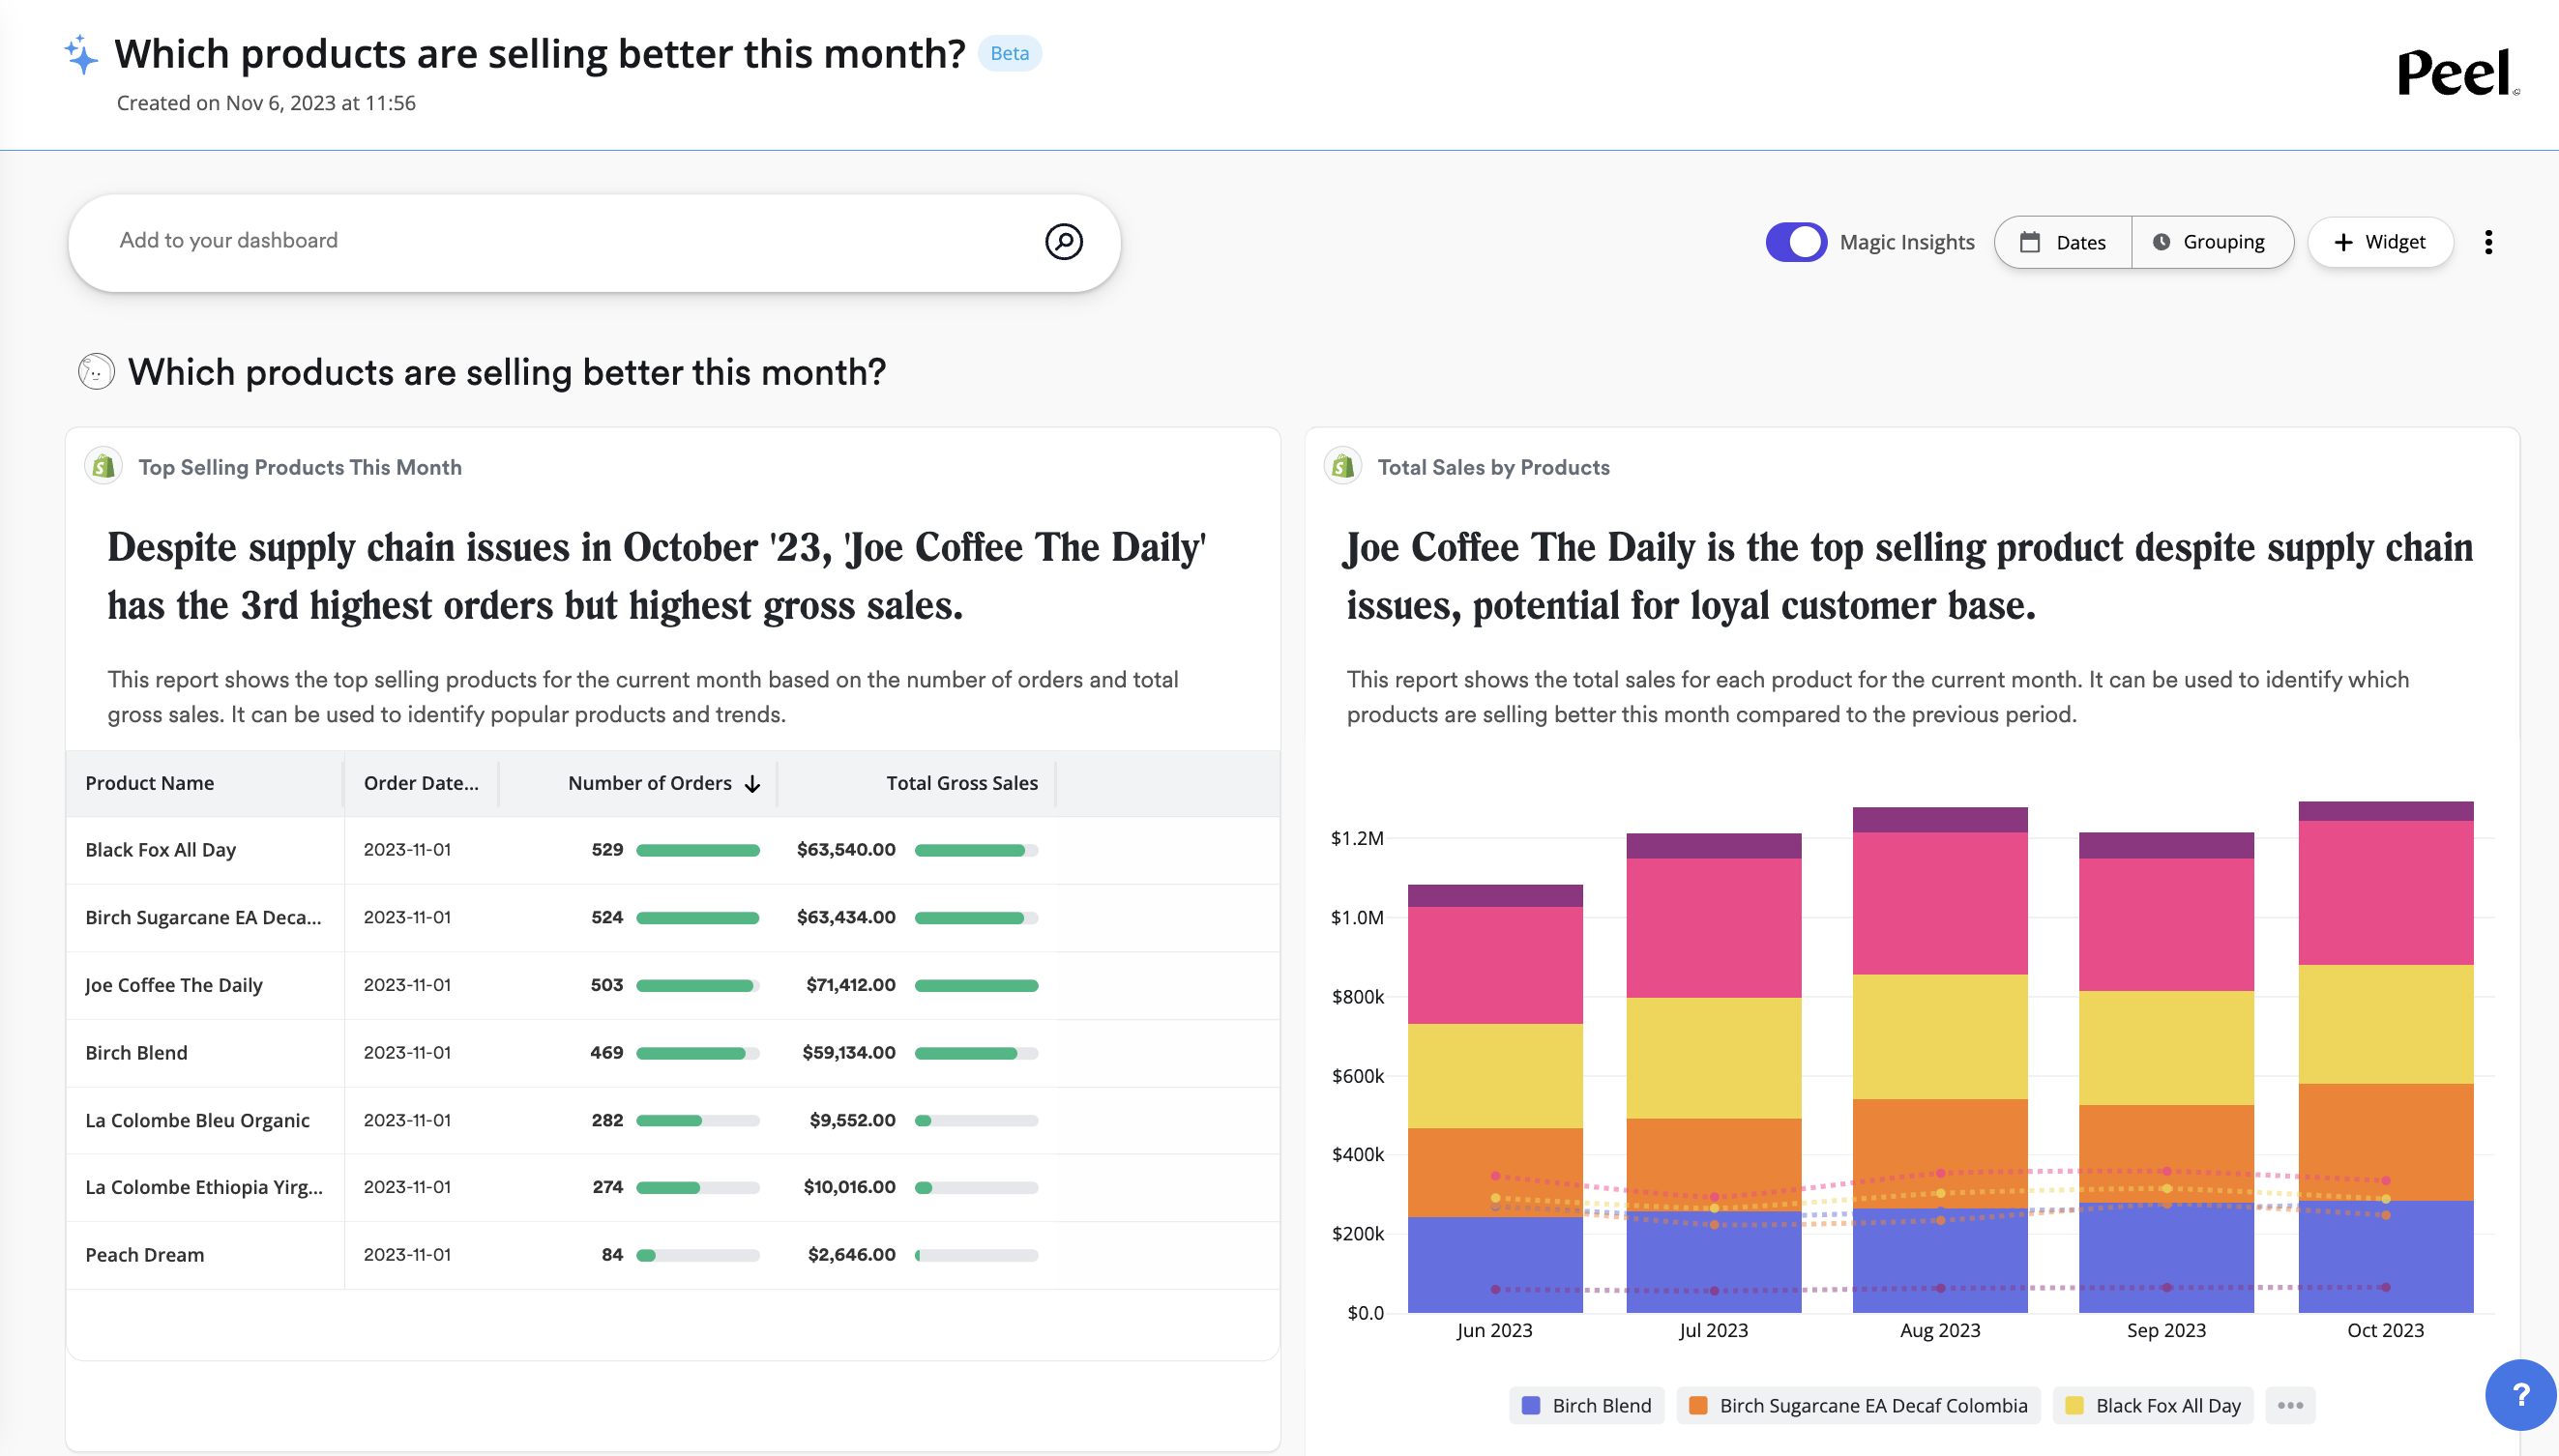
- Turn on the
Magic Insightstoggle to see Insights about your data- The Insights will take a few seconds to load. They will automatically appear in the widgets when they are ready
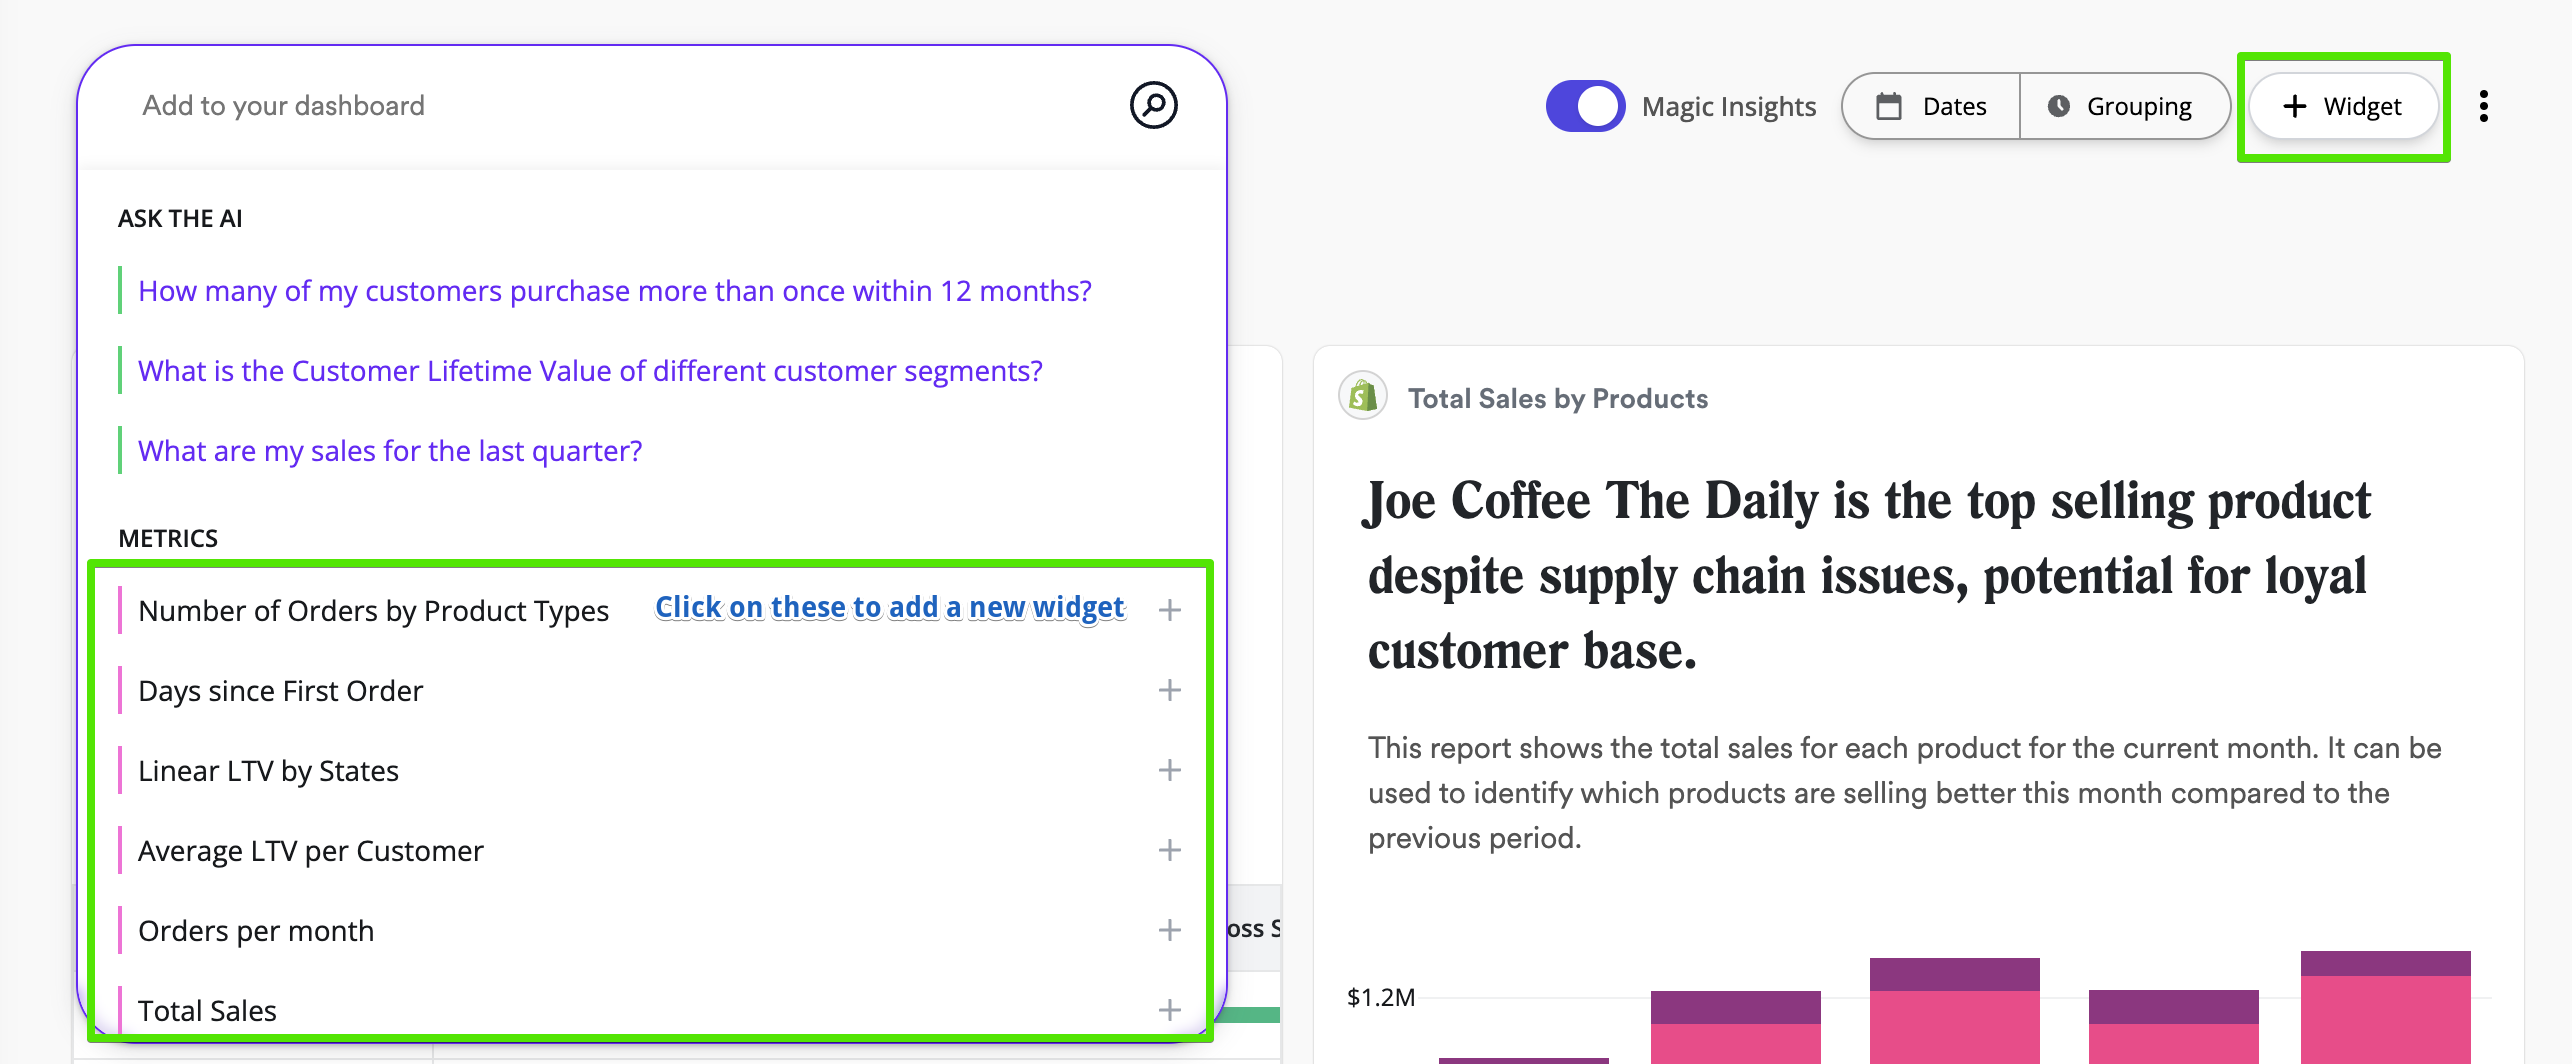
A new way of building Dashboards
- Add a new widget by clicking on
+ Widgetor select one of the metrics from the dropdown to add it to your Dash
Editing widgets with the brand new UI
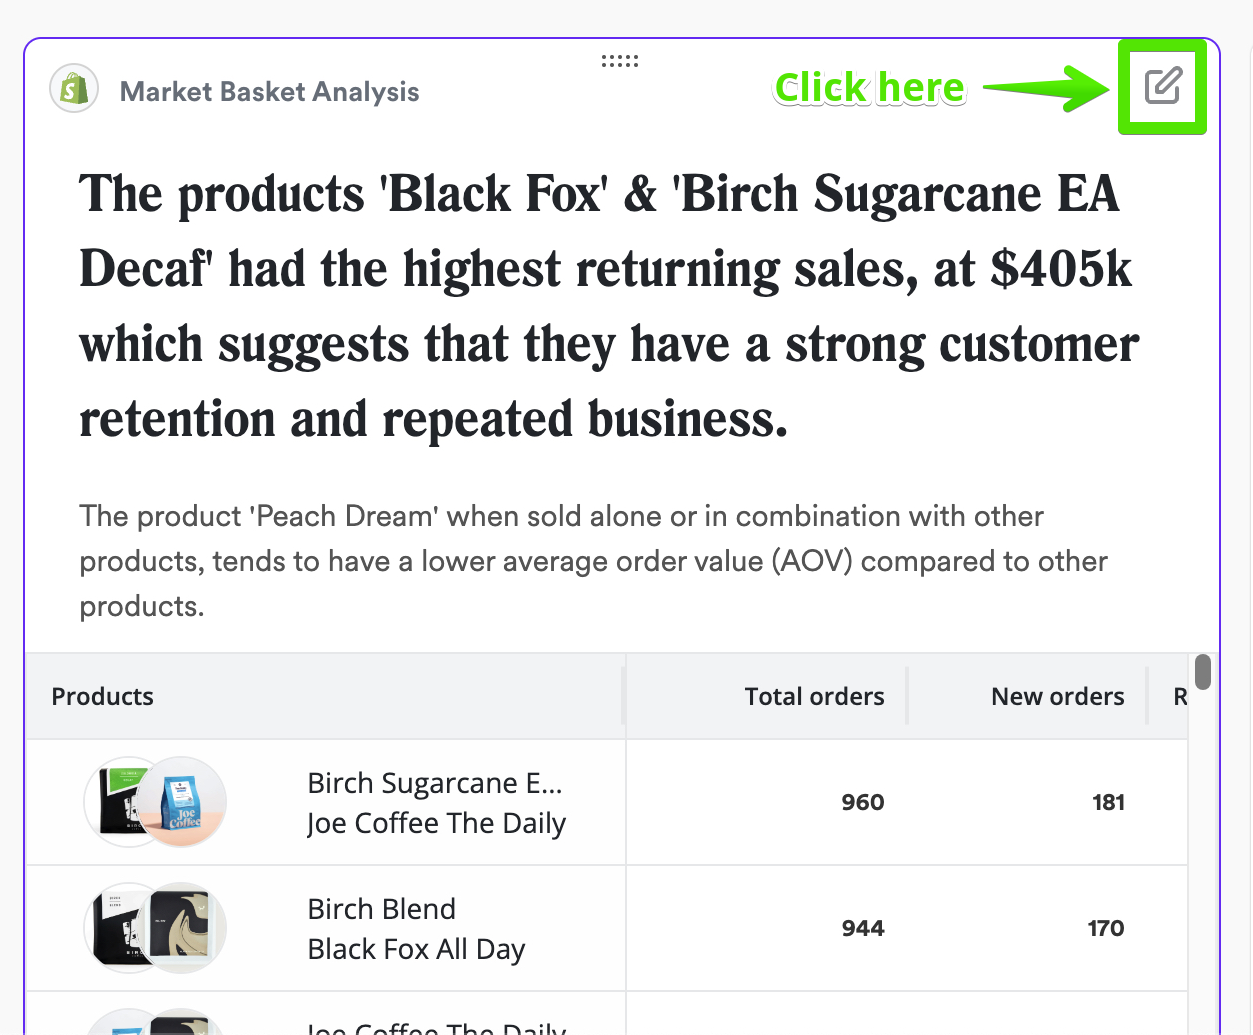
To open the Widget settings, click on the icon at the top right of each widget. From there, there are many optons for changing the widget
Editing titles and descriptions
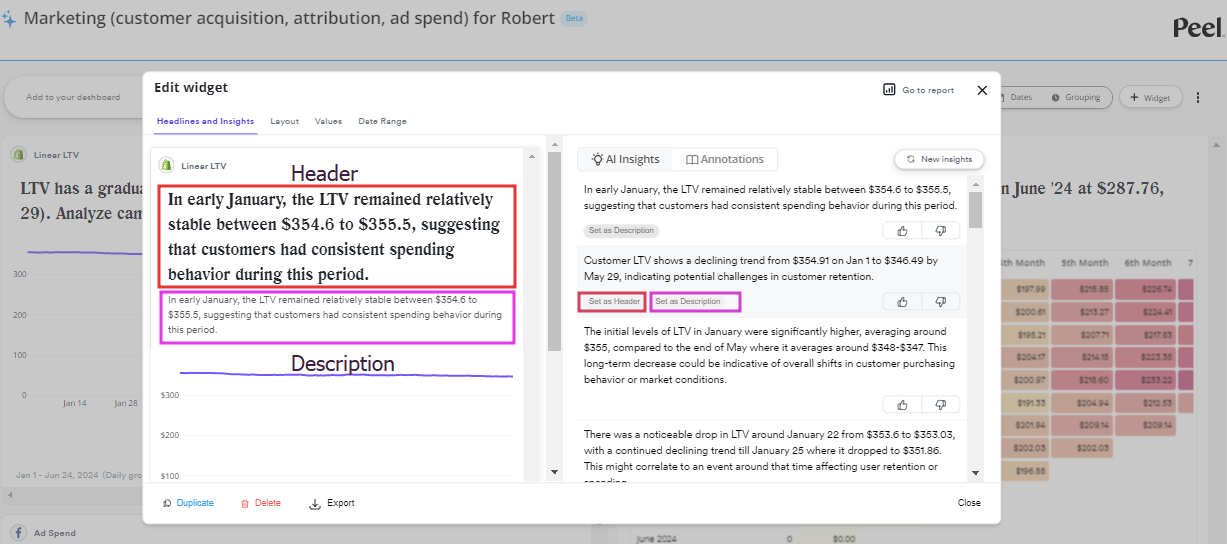
-
Click on the headline or description and start typing your own
-
You can set any of the AI Insights on the right as a headline or description
- Insights will automatically refresh in a dashboard that has been viewed in the past 7 days
-
Click on the
New Insightsbutton to generate new Insights from the AI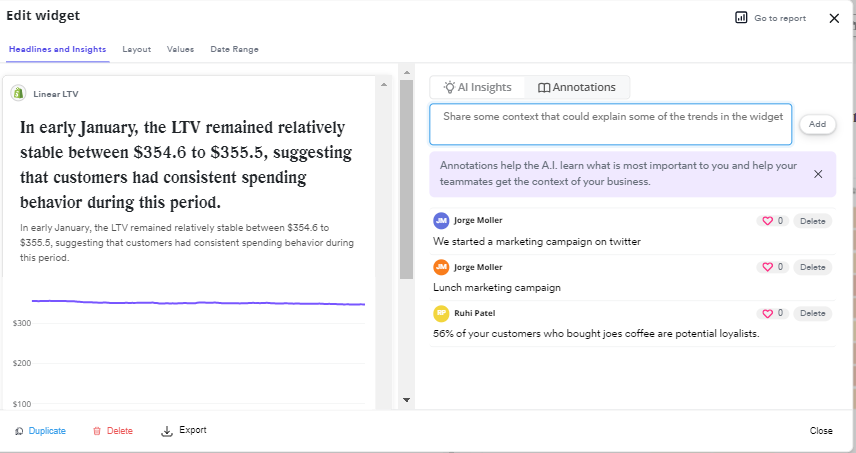
-
Add an Annotation to give the AI more context about your data. The AI will use the annotation for Insights
- For example, write an annotation to indicate if a certain campaign increased subscriptions, or if distribution issues affected sales for a certain month
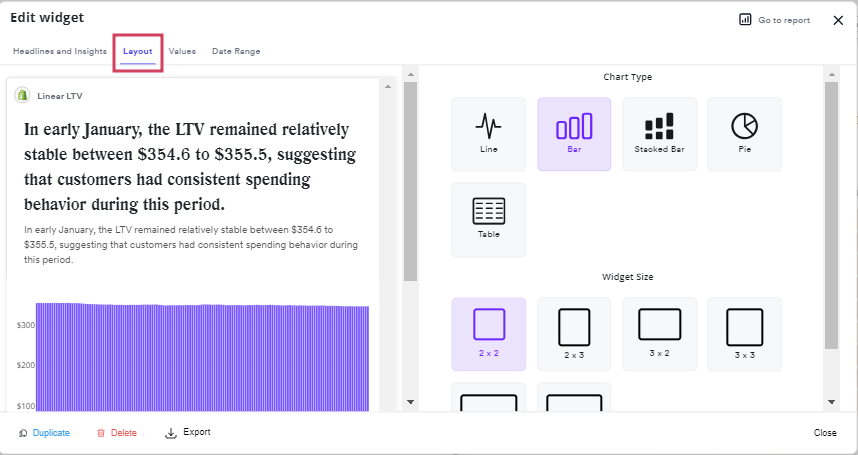
Changing formats and visualization
- Change the type of chart (line, bar, stacked bar, and pie) or the size of the widget in the Layout tab
- The Values tab lets you set the grouping for the chart
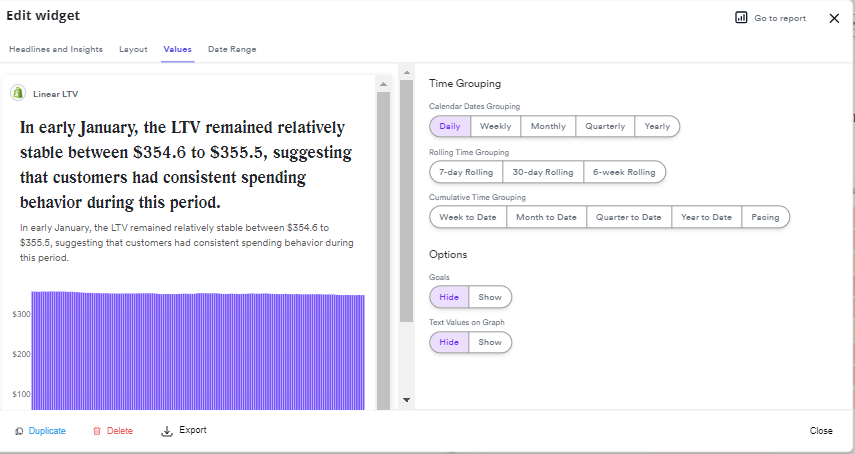
- If you've set up any goals, you can also choose to hide or show them here
- If you'd like to see the values of the data points right on the chart, you can also select that setting here
- Change the date range for the widget directly in the widget settings
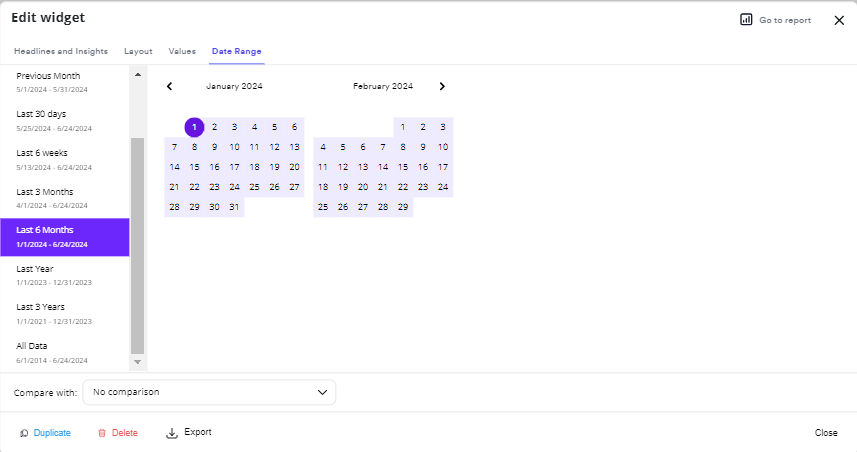
Exporting, deleting, and duplicating
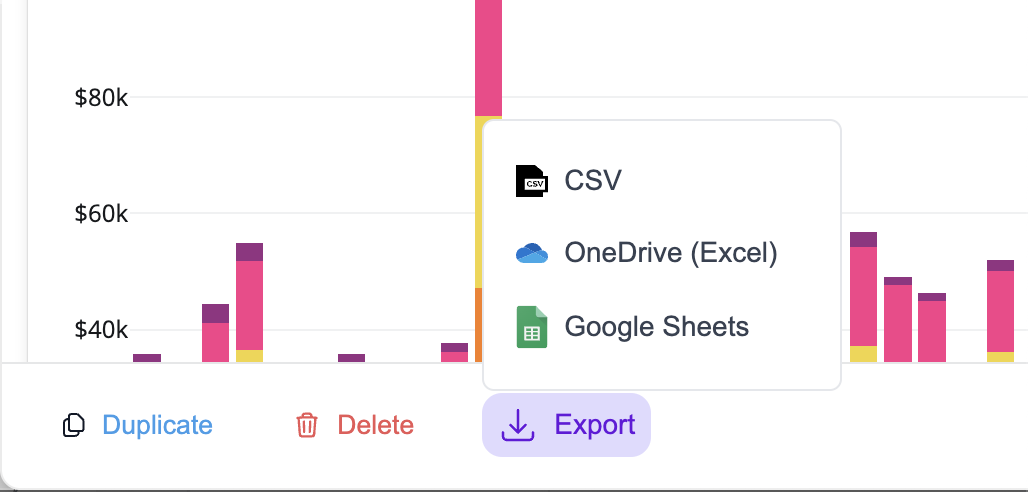
- Click on the
Exportbutton to export the data of a widget to a CSV file, OneDrive, or Google Sheets - You can also delete or duplicate a widget from here
Updated about 1 year ago