
The Peel Index
The Peel Index tracks changes in the e-commerce market since January 1, 2021. What you see is a composite of the performance and major trends across numerous e-commerce companies of various sizes and specialties.
Introducing the Peel Index

The Peel Index tracks changes in the e-commerce market since January 1, 2021. What you see is a composite of the performance and major trends across numerous e-commerce companies of various sizes and specialties.
Over time, the index number may either rise or fall depending on factors like market disruptions, seasonality, or big events like Black Friday.
Every company needs to know how the market at large is impacting their own sales. Peel customers can take the guess-work out of the equation now that they are equipped with this information. It can help you recognize how your company is performing in comparison to others so you make better decisions.
Why does the Index matter?
Until its release, most of your data analyses were done in silos, trying to understand the impact of your business operations on sales and leaving the rest of the analyses to non-data-driven news from Twitter, newsletters or podcasts. With the index, Peel is starting to bridge the gap between consumer behavior changes and trends and your business for all the events out of your control.
Index 101"An index starts in a given year, the base year, at an index number of 100. In subsequent years, percentage increases push the index number above 100, and percentage decreases push the figure below 100.
An index number of 102 means a 2% rise from the base year, and an index number of 98 means a 2% fall."
For example, the Dow Jones Industrial Average was at 100 in the year 1906 and 1,000 in 1972. Today it is around 35,000
Peel's Three Indexes
Gross Sales
Average Order Value (Gross)
Ad Spend
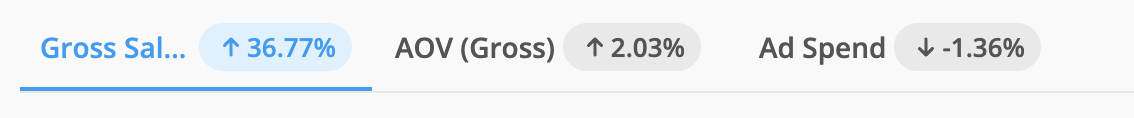
Switch between the tabs above the graph (see image) to view each of the three indexes we track.
Each of these metrics tells a great deal of information such as if buyers universally purchase fewer items than they did last year. Or whether your company is keeping up with advertising spend during this time of the year? Now you can know!
-
Gross Sales to track how your company compares to the industry at large
Gross Sales (Sum of gross sales = product price x quantity (before taxes, shipping, discounts, and returns))
Data sources: Shopify, Amazon Seller Central -
Average Order Volume (AOV) (Gross) to track consumer spending habits
Gross Sales divided by the Number of Orders
Data sources: Shopify, Amazon Seller Central -
Ad Spend to track market-wide adjustments in marketing spend
The blended total of advertising spend across your marketing platforms
Data sources: Facebook Ads, Google Ads, Pinterest Ads, TikTok
Note: Insights related to Ad Spend will only show up if you have connected marketing platforms to Peel
Note: This will only be available if you connect your ad spend accounts to Peel
How to Read the Peel Index
Since January 1st, 2021, we've been tracking the different directions that the e-commerce market has been nudging toward each day. We may see different economic trends overall, but that information may not pertain to e-commerce.
Timeframes
You can select different timeframes to view the index by clicking on the options on the top right of the graph:
- 1 month
- 3 months
- 6 months
- Year-to-date (from the beginning of the year to yesterday)
- All (from January 1, 2021 to yesterday)
The line on the chart represents the index and it will be green to indicate an increase and red to indicate a decrease from the previous time period (ex. If 1M is selected, it will be green if there has been an increase in the index since the previous month). Normally the rates of change will be a small percentage though there are times of the year when you might see substantial movement.
The bars on the chart show the actual Revenue, AOV, or Ad spend of your account for that time period.
The Core Metrics
You will see two highlighted values to the left side of the graph. We will begin with the top one - the Index.
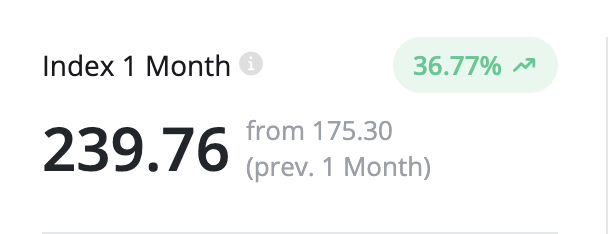
- In bolded black is the Peel Index number today - 239.76
- In gray you can see what the Index number was 1 month ago - 175.30
- We then calculate the percent change for that time period - 36.77%
- *Green indicates an increase and red indicates a decrease
Changing the time periods on the chart will change the time period for these values as well (1M, 3M, 6M, YTD, or ALL).
The second metric shows you a $ figure that is tied to your company account alone - no other company will see the same number.
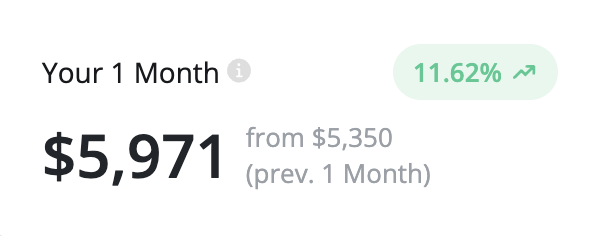
- In bolded black is your current Gross Sales, AOV, or Ad Spend - $5,971
- In gray you can see what the metric value was in the previous time period - 5,350
- We then calculate the percent change for that time period - 11.62%
- *Green indicates an increase and red indicates a decrease
Looking Back
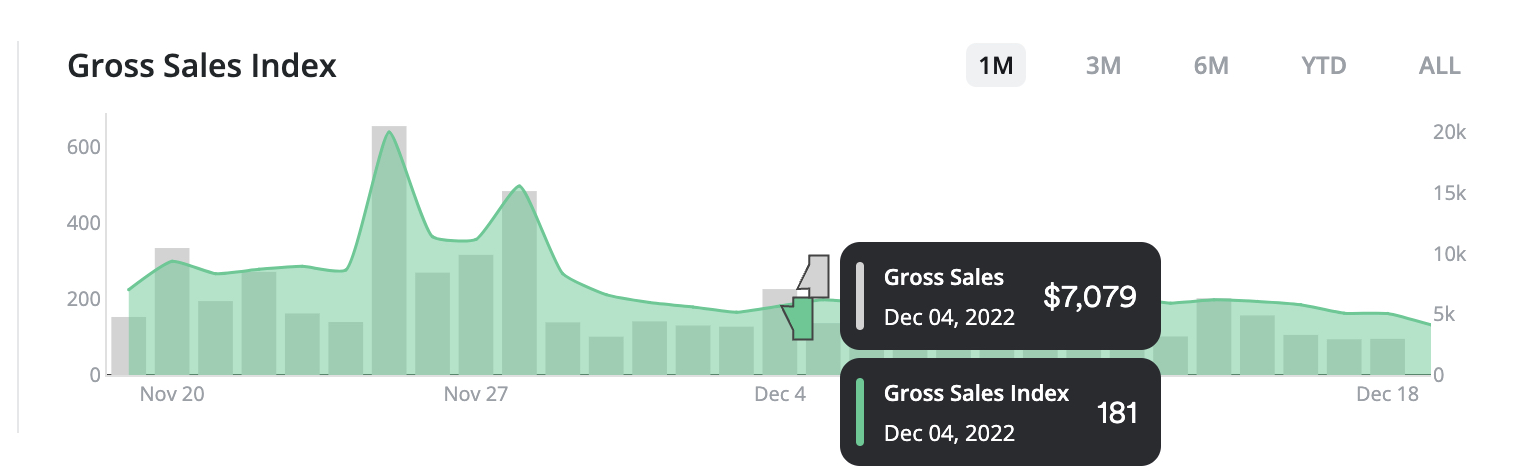
It may take some time to learn the ins and outs of how the graph works but in general, think of it as a time capsule for comparison to today.
By hovering over a certain day you will see two different numbers pop up - an Index Number and a Company $ Figure.
These two numbers show you what the Peel Index looked like on any given day and how your company performed.
In Summary
In time, as you check the Peel Index more and more you will understand how the market fluctuations may be impacting your company. Sometimes knowing if you are swimming in smoother or choppier economic waters can help you understand where to prioritize your time.
Our goal is simply for you to get a quick snapshot of your company performance - and compare it to the average - each day in order to be better equipped. Like any Index or Stock market you may be more used to seeing - we will be here telling it like it is and you get to decide what to do with the data
FAQ
“Where are you pulling this data from?”
For privacy reasons, our team can’t access the list of accounts used in the Peel Index, and that list is updated from time to time. Not all accounts are used in the Index - only a handful of random ones. However, you can request to not be included (-you won't know & we won't either) by contacting us at any time, so please do not hesitate to ask us to “do not include me us in Peel index data”.
“If I sign up for Peel can I make sure my company’s data isn’t being used?”
For privacy reasons, our team can’t access the list of accounts used in the Peel Index, and that list is updated from time to time, but we can make sure absolutely nothing connected to your company is being used.
“How many companies are on the list?”
The list and its size remain private. The Index is computed using data from a variety of e-commerce companies of different sizes, industries, years of operation, and geographies. Peel works with hundreds of LTV-focused brands but only a representative group is used.
“How do you calculate Revenue?”
The Revenue here is Gross Sales = unit price x quantity, in USD. We make the currency conversion because some prices and sales vary more than others due to inflation and recessions alone, and our goal is solely to capture changes in customer behavior.
“Is AOV gross or net?”
The AOV here is Gross AOV (Gross Sales divided by the Number of Orders)
“I don’t see any Ad Spend on the chart. Is the chart broken?”
Ad Spend will only be available if you connect your marketing accounts to Peel. It is the blended total of advertising spend across your marketing platforms.
Updated 6 months ago